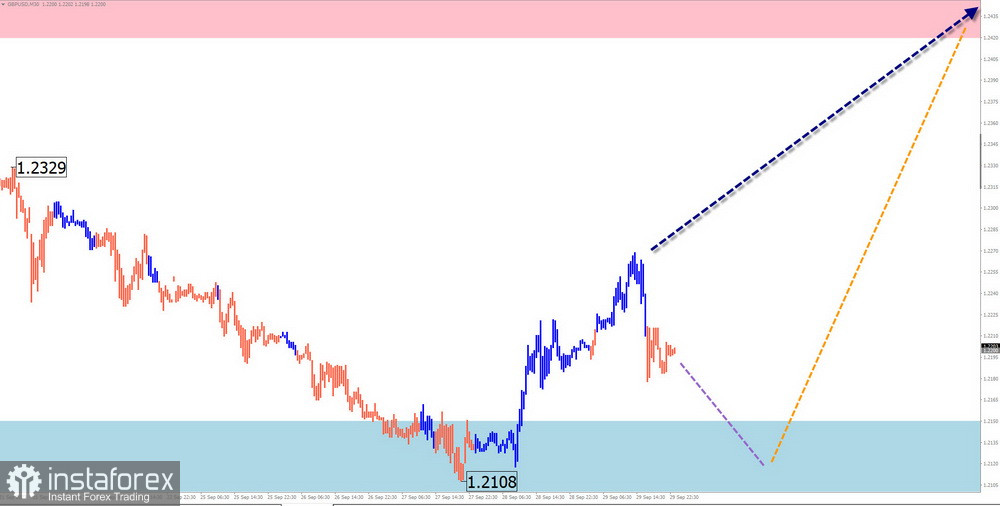
GBP/USD
Brief Analysis:
The major of the British pound has been pushing the pair's quotes down on the price chart since mid-July. The price has reached the upper boundary of a potentially reversal zone. Last week, a corrective phase began to form on the chart, which has not yet been completed.
Weekly Forecast:
At the beginning of the upcoming week, there is likely to be a repeat decline in the price of the British currency to the calculated support levels. Afterwards, we can expect a reversal to form. By the end of the week, we can anticipate the beginning of an upward price movement. The resistance zone represents the maximum expected upper boundary of the weekly range for the pair.
Potential Reversal Zones
Resistance:
Support:
Recommendations
Selling: Can be used within individual sessions with a reduced lot size. The downside potential is limited by the support zone.
Buying: Will become relevant after the appearance of corresponding signals from your trading systems in the support zone.
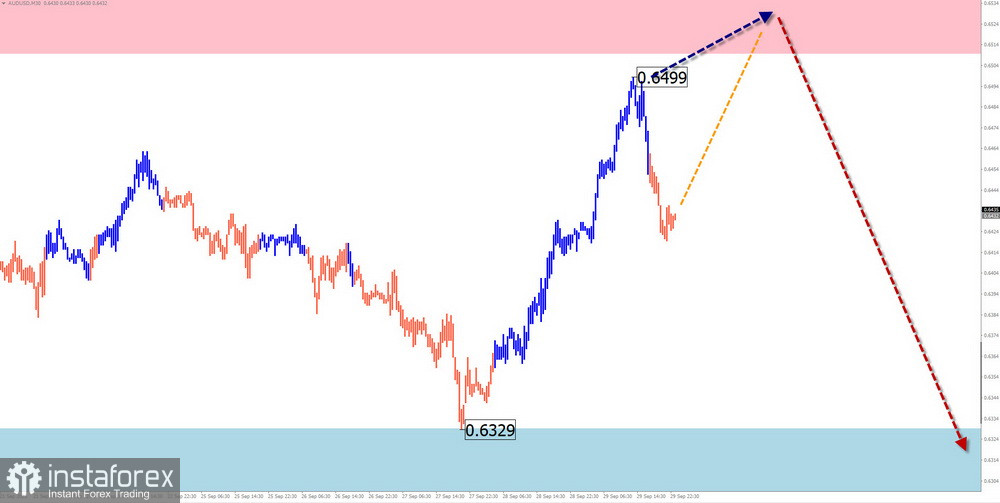
AUD/USD
Brief Analysis:
A descending trend dominates the market for the major Australian dollar pair. The count has been underway since July 14th. The price has closely approached the upper boundary of a potentially reversal zone over a large time frame. Over the past two months, the price has formed a correction along this boundary in the form of a stretched flat. The structure of the entire wave is nearing completion.
Weekly Forecast:
In the upcoming week, we expect the continuation of the Aussie's price movement within the corridor between the nearest zones of opposing directions. After potential pressure on the resistance zone at the beginning of the week, we can expect a reversal and a price rollback to the support zone. When the direction changes, a brief breach of the upper boundary of the zone is not excluded.
Potential Reversal Zones
Resistance:
Support:
Recommendations
Selling: Will be possible after the appearance of confirmed signals in the support zone.
Buying: Can be used with a reduced lot size within intraday trading. The resistance places a limit on the potential.
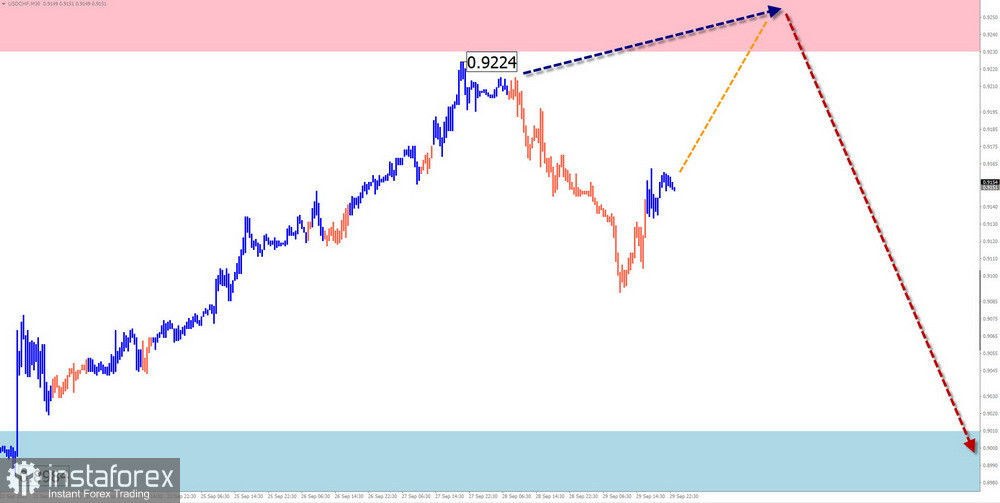
USD/CHF
Brief Analysis:
On the chart of the major Swiss franc pair, the ascending wave that started in mid-July continues to dominate. The quotes have come close to the lower boundary of a powerful reversal zone on a monthly scale chart. However, the wave structure does not indicate completion. There are no signals of an imminent change in course as of yet.
Weekly Forecast:
After a likely attempt to exert pressure on the resistance zone in the coming days, the pair's price is expected to move mainly sideways. With a high probability, we can then expect a reversal and the beginning of a price decline. When the course changes, a brief breach of the upper boundary of the resistance zone is not excluded.
Potential Reversal Zones
Resistance:
Support:
Recommendations
Buying: Due to the limited potential, there is a high probability of deposit loss.
Selling: Fractional lots can be used after the appearance of corresponding signals from your trading systems in the resistance zone.
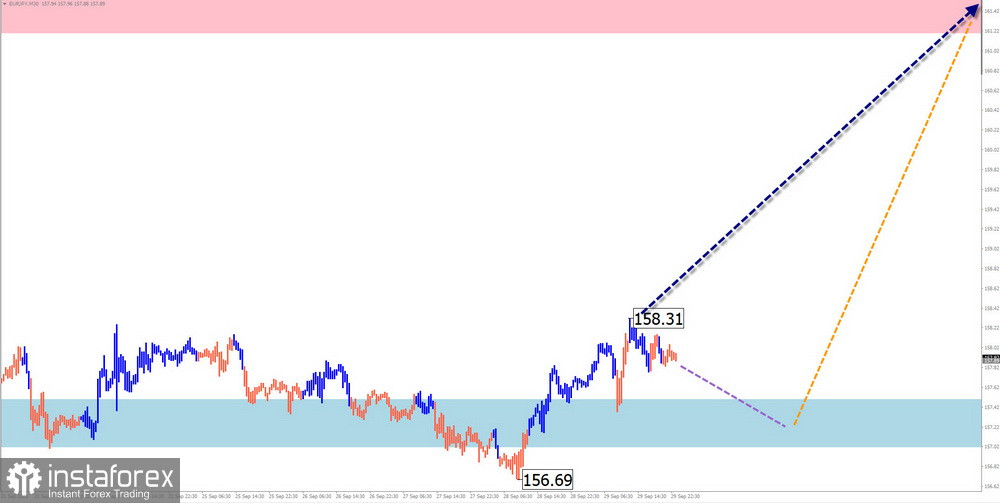
EUR/JPY
Brief Analysis:
As of the analysis moment, the ascending wave pattern for the euro/yen chart started on July 28th. Over the past month and a half, a flat correction has been developing within it on a horizontal plane. The wave is not yet complete at the time of analysis. After the full completion of the retracement, the bullish trend of the pair will continue.
Weekly Forecast:
At the beginning of the upcoming week, the pair's price is expected to move sideways along the boundaries of the support zone. By the end of the week, a reversal and the resumption of the price ascent can be expected.
Potential Reversal Zones
Resistance:
Support:
Recommendations
Selling: Possible within intraday trading with fractional lots. The potential for trade is limited by support.
Buying: After the appearance of confirmed reversal signals in the support zone, they may be recommended as the main direction for trading.
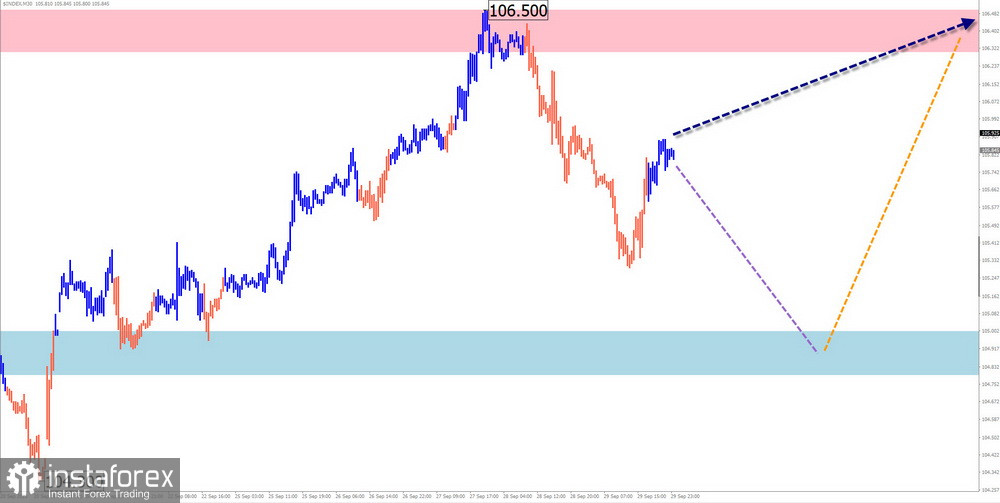
USDollar Index
Brief Analysis:
The short-term bullish trend of the US dollar, which started in mid-July, continues. The quotes have reached the lower boundary of a potentially reversal zone on the daily time frame. The wave structure does not indicate completion. At the end of the last week, a descending segment began to form.
Weekly Forecast:
In the first half of the upcoming week, a general sideways movement of the index is most likely. A downward vector is possible, with a decrease not below the support zone area. Afterward, the dollar's rate is expected to resume its ascent.
Potential Reversal Zones
Resistance:
Support:
Recommendations
Placing bets on the dollar's continued growth in the near future is risky and may lead to deposit losses. The optimal tactic will be to refrain from trading in major pairs until signals of the dollar's rate increase appear.
Notes: In simplified wave analysis (SWA), all waves consist of three parts (A, B, and C). In each time frame, the latest, unfinished wave is analyzed. Dashed lines indicate expected movements.
Attention: The wave algorithm does not take into account the duration of instrument movements in time!