empty
29.09.2023 06:21 AM
Trading Signals for USD/JPY for September 29-30, 2023: sell below 149.35 (21 SMA - exhaustion)

This image is no longer relevant

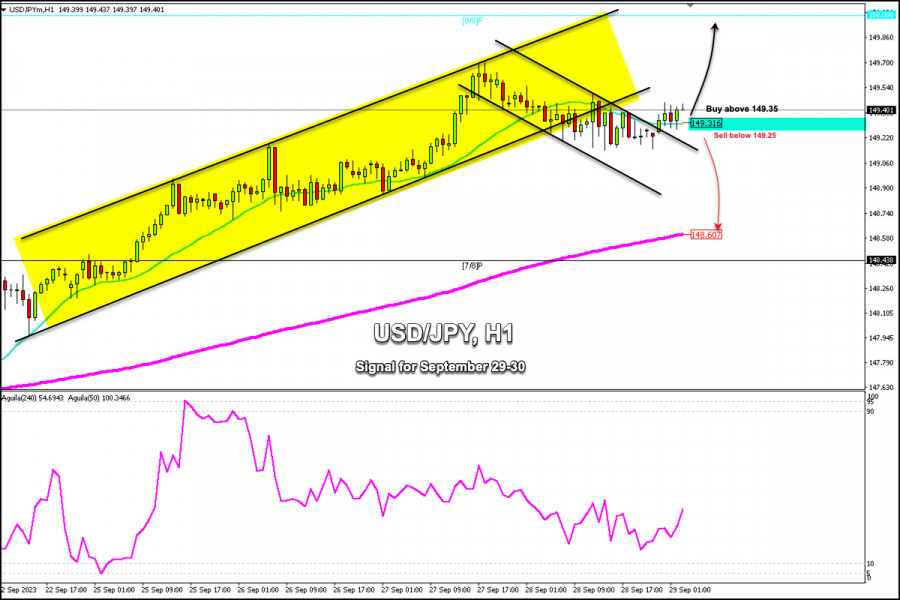
Early in the European session, USD/JPY is trading around 149.40, above the 21 SMA, and above the 200 EMA. On the H-1 chart, we can see that it is bouncing slightly and intends to continue its uptrend but is showing levels of exhaustion.

In the next few hours, the USD/JPY pair is expected to consolidate above 149.31. This would mean that it could continue to rise and the instrument could reach 149.70 and could even reach the psychological level of 150.00 around 8/8 Murray.

On the contrary, in case the Japanese Yen falls below the 21 SMA, we could expect it to quickly reach the 200 EMA located at 148.60 and even 7/8 of Murray at 148.35.

The eagle indicator is giving a positive bullish signal. However, we can see that it left a gap around 149.18. If this GAP is covered, we could expect a fall towards 148.60 in the next few hours.

The daily pivot point is located at 149.34. If in the next few hours, the USD/JPY consolidates below this level, it could be seen as an opportunity to sell with targets at 149.06 and 148.60 (200 EMA). The instrument could even reach 6/8 Murray at 146.87.

Dimitrios Zappas,
Especialista em análise na InstaForex
© 2007-2025
Selecionar intervalo de tempo
5
min
15
min
30
min
1
hora
4
horas
1
dia
1
s.
Ganhe com as variações das taxas das criptomoedas com a InstaForex.
Baixe o MetaTrader 4 e abra a sua primeira operação.
  • Grand Choice
    Contest by
    InstaForex
    InstaForex always strives to help you
    fulfill your biggest dreams.
    PARTICIPE DO CONCURSO

Recommended Stories

AUD/USD. O início da implementação das tarifas em 2 de abril pode pressionar a paridade

O dólar australiano permanece em uma fase de consolidação, flutuando dentro de uma faixa estreita entre 0,6265 e 0,6325. A próxima implementação de tarifas por Trump contra a China

Pati Gani 17:27 2025-03-27 UTC+2

GBP/USD – 27 de março: A inflação impacta negativamente a libra

No gráfico horário, o par GBP/USD continuou seu declínio na quarta-feira, quase atingindo o nível 1,2865, perdendo-o por apenas alguns pontos. Não houve recuperação do nível 1,2931 hoje, embora

Samir Klishi 16:41 2025-03-27 UTC+2

#NDX – Visão geral da análise técnica

Uma estagnação no nível mensal da tendência de curto prazo (19730) levou os touros a se esforçarem para recuperar suas posições. Como resultado, formou-se um gap de alta no início

Evangelos Poulakis 16:30 2025-03-27 UTC+2

EUR/USD – 27 de março: O dólar se fortalece gradualmente

Na quarta-feira, o par EUR/USD continuou a cair, encontrando suporte perto do nível de retração Fibonacci de 161,8%, em 1,0734. Uma recuperação a partir deste ponto permitiu

Samir Klishi 15:54 2025-03-27 UTC+2

Sinais de negociação para o OURO (XAU/USD) para 27-29 de março de 2025: venda abaixo de $3.057 (topo duplo - 7/8 de Murray)

Se o ouro não conseguir romper acima de 3.057, isso será visto como um sinal de venda, com alvo em 3.023. Além disso, podemos esperar que o preço atinja

Dimitrios Zappas 14:46 2025-03-27 UTC+2

Sinais de negociação para EUR/USD para 27-29 de março de 2025: compre acima de 1,0790 (SMA 21 - 8/8 de Murray)

Se o euro continuar sua recuperação e se consolidar acima de 1,0790 nas próximas horas, podemos esperar que o EUR/USD continue subindo. Assim, o instrumento pode atingir o nível +2/8

Dimitrios Zappas 14:34 2025-03-27 UTC+2

Sinais de negociação para EUR/USD para 26-28 de março de 2025: venda abaixo de 1,0808 (SMA 21 - 8/8 de Murray)

Com base no gráfico de 4 horas, o euro parece estar sobrevendido, e acreditamos que, se o EUR/USD encontrar um forte suporte em torno do nível 8/8 de Murray

Dimitrios Zappas 16:12 2025-03-26 UTC+2

Sinais de negociação para o OURO (XAU/USD) para 26-28 de março de 2025: venda abaixo de $3.034 (SMA 21 - 7/8 de Murray)

O ouro pode continuar seu ciclo de baixa nos próximos dias. Para confirmar essa tendência de baixa, devemos esperar uma consolidação abaixo de 3.020. Nesse caso, o preço pode atingir

Dimitrios Zappas 16:09 2025-03-26 UTC+2

Análise técnica do movimento intradiário de preços do índice Nasdaq 100, quarta-feira, 26 de março de 2025.

Podemos observar no gráfico de 4 horas que o par AUD/JPY está se movendo de forma consistente dentro de um canal de alta, negociando acima da média móvel exponencial

Arief Makmur 14:03 2025-03-26 UTC+2
Não pode falar agora?
Faça sua pergunta no chat.
Widget callback
 

Dear visitor,

Your IP address shows that you are currently located in the USA. If you are a resident of the United States, you are prohibited from using the services of InstaFintech Group including online trading, online transfers, deposit/withdrawal of funds, etc.

If you think you are seeing this message by mistake and your location is not the US, kindly proceed to the website. Otherwise, you must leave the website in order to comply with government restrictions.

Why does your IP address show your location as the USA?

  • - you are using a VPN provided by a hosting company based in the United States;
  • - your IP does not have proper WHOIS records;
  • - an error occurred in the WHOIS geolocation database.

Please confirm whether you are a US resident or not by clicking the relevant button below. If you choose the wrong option, being a US resident, you will not be able to open an account with InstaForex anyway.

We are sorry for any inconvenience caused by this message.