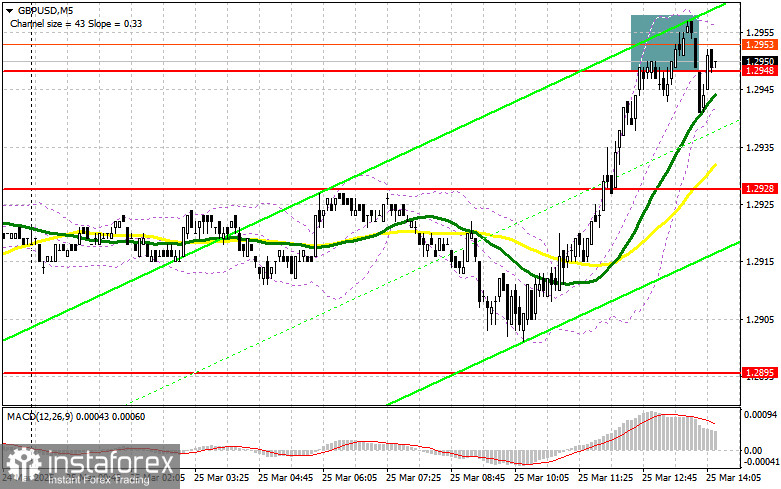
In my morning forecast, I drew attention to the 1.2948 level and planned to make trading decisions from it. Let's look at the 5-minute chart and see what happened. A rise followed by a false breakout around 1.2948 provided a good entry point for short positions on the pound, but a larger sell-off never materialized. The technical picture has been slightly revised for the second half of the day.
To open long positions on GBP/USD:
The lack of significant statistics from the UK once again supported the British pound, prompting a recovery from weekly lows. Further pound strength will entirely depend on U.S. data. Special attention will be paid to the U.S. Consumer Confidence Index, though new home sales and the Richmond Fed Manufacturing Index should not be overlooked either. Weak figures — something the U.S. economy has produced frequently lately — could further undermine the dollar's purchasing power and strengthen the pound.
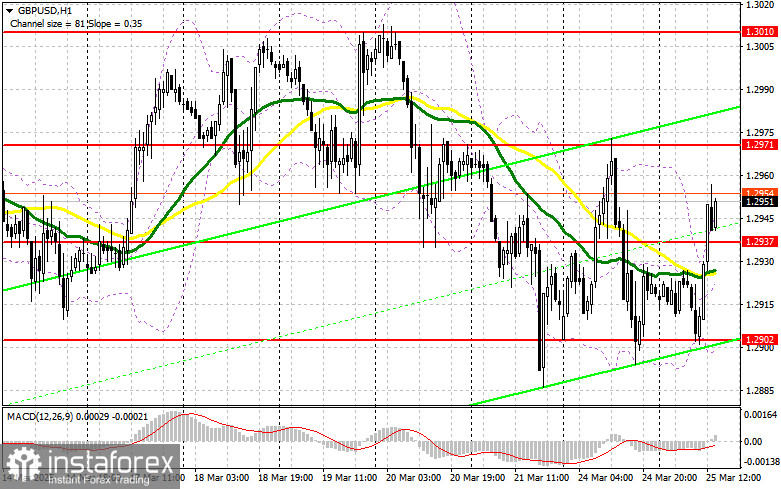
Also, don't forget to listen to FOMC member John Williams' speech. In the case of a bearish reaction, only a false breakout around 1.2937 will offer a good entry point for long positions with the goal of reclaiming resistance at 1.2971. A breakout and retest from above would confirm a new buying opportunity with the aim of reaching 1.3010 and resuming the bullish trend. The furthest target will be 1.3056, where I plan to take profit.
If GBP/USD falls and there's no bullish activity around 1.2937 in the second half of the day, pressure on the pound may return, confining the pair within a sideways channel. In that case, a false breakout around 1.2902 would provide a suitable setup to open long positions. I also plan to buy GBP/USD on a rebound from 1.2874, aiming for a 30–35 point intraday correction.
To open short positions on GBP/USD:
The pound has risen significantly, but sellers are still present, as evidenced by the reaction around 1.2948. However, for the second half of the day, the focus shifts to defending the more substantial resistance at 1.2971, since 1.2948 did not trigger any meaningful pullback. If the market reacts bullishly to the U.S. reports, only a false breakout at 1.2971 would provide an entry point for short positions, targeting support at 1.2937, which formed earlier today.
A breakout and retest of that level from below would trigger stop-losses and open the way to 1.2902, which would mark a notable correction. The furthest target will be 1.2874, where I plan to take profit. A test of this level would likely halt the bullish market's development.
If demand for the pound remains in the second half of the day and bears don't show up around 1.2971, it's best to delay short positions until a test of the 1.3010 resistance. I'll consider shorts there only after a failed consolidation. If there's no downward reaction even from that level, I'll look for short entries at 1.3056, only expecting a 30–35 point correction from that point.
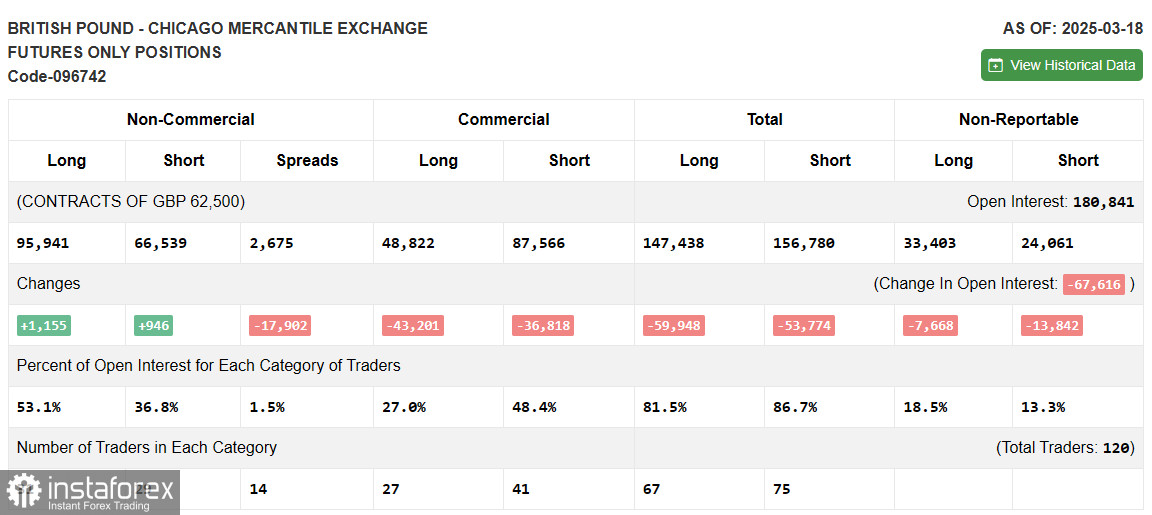
COT Report (Commitment of Traders) as of March 18:
The report showed growth in both long and short positions. However, the increase in long positions was significantly larger, tipping the balance further in favor of pound buyers. This is also confirmed by the GBP/USD chart. The Bank of England's recent meeting revealed a more gradual approach to rate cuts, and it's possible that the stance may become more hawkish going forward.
Many market participants are alarmed by Trump's actions and tariffs, which could spark inflation — already a challenge for the UK. The BoE's current policy is supporting pound buyers and is expected to continue doing so.
The latest COT report showed that long non-commercial positions increased by 1,155 to 95,941, while short non-commercial positions rose by just 946 to 66,539. As a result, the gap between long and short positions narrowed by 17,902.
Indicator Signals:
Moving Averages: Trading is taking place above the 30- and 50-period moving averages, indicating buyers are trying to regain control of the market.
Note: The period and prices of the moving averages are based on the H1 chart and may differ from the classical definitions on the daily D1 chart.
Bollinger Bands: In case of a decline, the lower boundary of the indicator around 1.2902 will act as support.
Indicator Descriptions:
- Moving Average (MA): Defines the current trend by smoothing volatility and noise. Period – 50 (yellow line); Period – 30 (green line).
- MACD (Moving Average Convergence/Divergence): Fast EMA – period 12; Slow EMA – period 26; Signal SMA – period 9.
- Bollinger Bands: Period – 20.
- Non-commercial traders: Speculators such as individual traders, hedge funds, and large institutions using the futures market for speculative purposes.
- Non-commercial long positions: Total open long positions held by non-commercial traders.
- Non-commercial short positions: Total open short positions held by non-commercial traders.
- Net non-commercial position: The difference between long and short non-commercial positions.