empty
26.04.2023 12:26 AM
Technical analysis of GBP/USD for April 25, 2023

This image is no longer relevant

Overview:

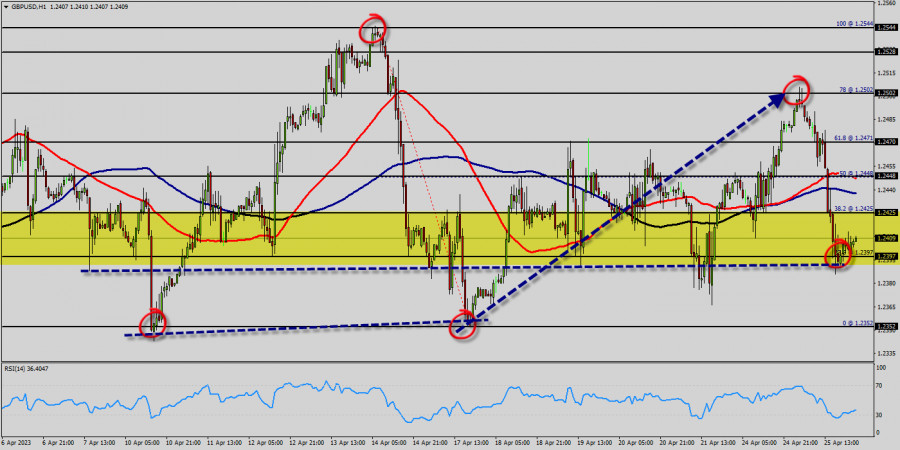
The bullish trend is currently very strong on The GBP/USD pair. As long as the price remains above the support levels of 1.2397, you could try to benefit from the growth. The first bullish objective is located at the price of 1.2425. The bullish momentum would be boosted by a break in this resistance (1.2425).

The hourly chart is currently still bullish. At the same time, some stabilization tendencies are visible between 1.2397 and 1.2035. Together with the relatively large distance to the fast-rising 100-day moving average (1.2035), there are some arguments for a relief rally in coming months on the table.

The GBP/USD pair is at highest against the dollar around the spot of 1.2035 since last week. The GBP/USD pair is inside in upward channel. For some weeks the GBP/USD pair decreased within an up channel, for that the GBP/USD pair its new highest 1.2067. Consequently, the first support is set at the level of 1.2035. Hence, the market is likely to show signs of a bullish trend around the area of 1.2000 and 1.2035.

RSI is seeing major support above 33% and a bullish divergence vs price also signals that a reversal is impending. According to the previous events the price is expected to remain between 1.2425 and 1.2397 levels. Buyers would then use the next resistance located at 1.2067 as an objective. Crossing it would then enable buyers to target 1.2502 (the double top - last bullish week).

Be careful, given the powerful bullish rally underway, excesses could lead to a possible correction in the short term. If this is the case, remember that trading against the trend may be riskier. It would seem more appropriate to wait for a signal indicating reversal of the trend. The GBP/USD pair has plunged up for a fresh two weeks high.

Prices pushed above a key retracement from a Fibonacci setup that spans from the lowest price of 1.2397 (23.6% of Fibonacci on the hourly chart), for that buyer pulled the bid back-above that level by the end of the week.

This week, the GBP/USD pair traded up and closed the day in the red area near the price of 1.2397. Today it rose a little, rising above 1.2397. If the pair succeeds in passing through the level of 1.2425, the market will indicate the bullish opportunity above the level of 1.2425 in order to reach the second target at 1.2501.

In the very short term, the general bullish sentiment is confirmed by technical indicators. Therefore, a small upwards rebound in the very short term could occur in case of excessive bearish movements. The trend is still bullish as long as the price of 1.2397 is not broken. Thereupon, it would be wise to re-buy above the price of at 1.2397 with the objective of 1.2352. We should see the pair climbing towards the next target of 1.2300. The pair will move upwards continuing the development of the bullish trend to the level 1.2501 or 1.2544 in coming days.

Select timeframe
5
min
15
min
30
min
1
hour
4
hours
1
day
1
week
Earn on cryptocurrency rate changes with InstaForex
Download MetaTrader 4 and open your first trade
  • Grand Choice
    Contest by
    InstaForex
    InstaForex always strives to help you
    fulfill your biggest dreams.
    JOIN CONTEST

Recommended Stories

Trading Signals for EUR/USD for April 11-15, 2025: sell below 1.1470 (+2/8 Murray - overbought)

During the European session, the euro reached a new high around +2/8 Murray, located at 1.1473. This movement in EUR/USD occurred after the announcement by China's Ministry of Finance that

Dimitrios Zappas 16:44 2025-04-11 UTC+2

Trading Signals for GOLD (XAU/USD) for April 11-13, 2025: sell below $3,235 (+1/8 Murray - overbought)

Early in the American session, gold is undergoing a strong technical correction after reaching a new high around 3,237.69 for now. Economic data from the United States will be released

Dimitrios Zappas 16:04 2025-04-11 UTC+2

EUR/USD – April 11th. The Dollar's Decline Shows No Sign of Stopping

On Thursday, the EUR/USD pair spent the entire day in an upward move, gaining 400 points and approaching the 261.8% Fibonacci corrective level at 1.1318. A rebound from this level

Samir Klishi 12:36 2025-04-11 UTC+2

Forecast for GBP/USD on April 11, 2025

On the hourly chart, the GBP/USD pair continued its upward movement on Thursday and secured a position above the 127.2% corrective level at 1.3003 – by Friday morning. This suggests

Samir Klishi 12:32 2025-04-11 UTC+2

Forex forecast 11/04/2025: EUR/USD, GBP/USD, SP500, NASDAQ, and Bitcoin

Useful links: My other articles are available in this section InstaForex course for beginners Popular Analytics Open trading account Important: The begginers in forex trading need to be very careful

Sebastian Seliga 09:52 2025-04-11 UTC+2

EUR/USD Forecast for April 11, 2025

Over the past day and this morning, the euro has reached the target range of 1.1385–1.1420, corresponding to the highs of June 2019 and 2020. The signal line

Laurie Bailey 05:03 2025-04-11 UTC+2

GBP/USD Forecast for April 11, 2025

The British pound has reached the target level of 1.3001. The signal line of the Marlin oscillator is breaking through the zero line into bullish territory, opening the way toward

Laurie Bailey 05:03 2025-04-11 UTC+2

USD/JPY Forecast for April 11, 2025

Yesterday, the USD/JPY pair decisively broke through the wide support range of 145.08/91 and reached the target level of 143.45 during today's Pacific session. The Marlin oscillator has only recently

Laurie Bailey 05:03 2025-04-11 UTC+2

Trading Signals for GOLD (XAU/USD) for April 10-12, 2025: sell below $3,145 (21 SMA - 8/8 Murray)

The Eagle indicator is reaching oversold levels and is giving a negative signal, so we will look for opportunities to sell below 3,145 or below 3,131 with a target

Dimitrios Zappas 15:37 2025-04-10 UTC+2

EUR/USD. April 10. Trump Continues to Shake the Markets

On Wednesday, the EUR/USD pair made two rebounds from the resistance zone of 1.1081–1.1095, turned in favor of the U.S. dollar, and declined toward the support zone of 1.0944–1.0957

Samir Klishi 12:19 2025-04-10 UTC+2
Can't speak right now?
Ask your question in the chat.
Widget callback
 

Dear visitor,

Your IP address shows that you are currently located in the USA. If you are a resident of the United States, you are prohibited from using the services of InstaFintech Group including online trading, online transfers, deposit/withdrawal of funds, etc.

If you think you are seeing this message by mistake and your location is not the US, kindly proceed to the website. Otherwise, you must leave the website in order to comply with government restrictions.

Why does your IP address show your location as the USA?

  • - you are using a VPN provided by a hosting company based in the United States;
  • - your IP does not have proper WHOIS records;
  • - an error occurred in the WHOIS geolocation database.

Please confirm whether you are a US resident or not by clicking the relevant button below. If you choose the wrong option, being a US resident, you will not be able to open an account with InstaForex anyway.

We are sorry for any inconvenience caused by this message.