empty
01.03.2023 05:33 PM
Trading signals for GOLD (XAU/USD) on March 1-2, 2023: sell in case of pullback at $1,843 (3/8 Murray - GAP)

This image is no longer relevant

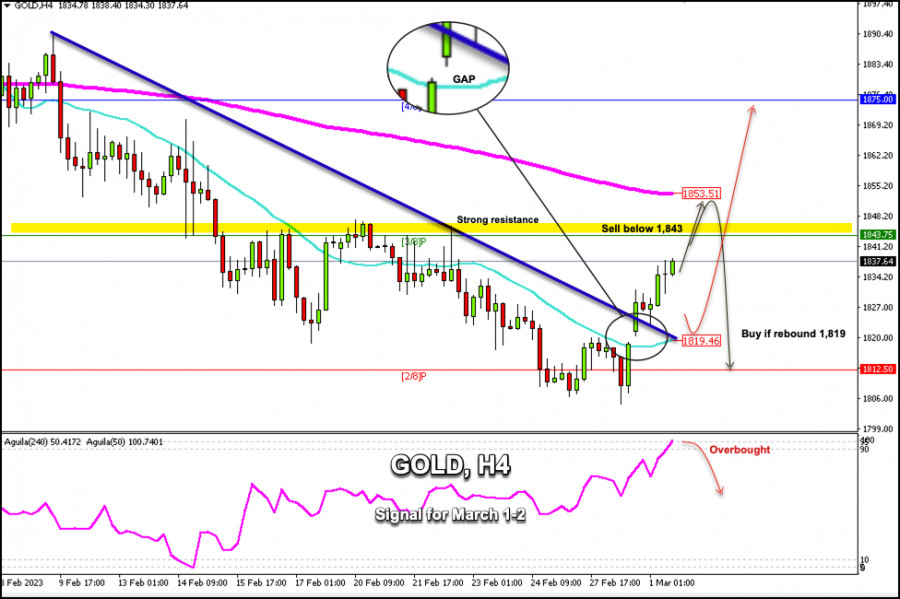
Early in the American session, Gold (XAU/USD) is trading around 1,837.74 above the 21 SMA and below the 200 EMA. According to the 4-hour chart, we can see that gold has a bullish bias. Yesterday in the European session, having reached a low of 1,804, the metal started a rebound, thus accumulating a profit of more than $30.

Gold left a gap at around 1,818 yesterday. If the instrument falls and returns to this zone, it could fill the gap and could be seen as a signal to buy on the technical bounce.

The weakness in the US Dollar Index (USDX) turned lower during the American session yesterday, helping XAU/USD to recover which left a gap. As gold is approaching a strong resistance area that has proven to be a barrier to it on previous occasions, it could be seen as a signal to sell around 1,843.

XAU/USD has found good support at 2/8 Murray around 1,812 and is expected to continue to rise as long as it trades above the psychological level of 1,800.

The eagle indicator is showing an overbought signal because it has reached the 95-point zone, which indicates an imminent correction. In the next few hours, we expect gold to reach the 3/8 Murray zone located at 1,843 which could be seen as a signal to sell with targets at the 21 SMA located at 1,820 and even fill the gap at 1,817.

In case the uptrend prevails, we could expect the metal to reach the 200 EMA located at 1,853. If this scenario comes true, it will be seen as a clear signal to sell with targets at 1,817 and 1,812 (2/8 Murray).

Dimitrios Zappas,
Analytical expert of InstaForex
© 2007-2025
选择时间框架
5
分钟
15
分钟
30
分钟
1
小时
4
小时
1
1
通过InstaForex赚取加密货币汇率变动的收益。
下载MetaTrader 4并开启您的第一笔交易。
  • Grand Choice
    Contest by
    InstaForex
    InstaForex always strives to help you
    fulfill your biggest dreams.
    JOIN CONTEST

推荐文章

#NDX – 技術分析概覽

在月度短期趨勢水平(19730)出現停滯,促使多頭努力奪回他們的位置。因此,在新交易周開始時形成了一個看漲缺口,測試了每週阻力水平20302。

Evangelos Poulakis 04:45 2025-03-27 UTC+2

2025年3月26日至28日EUR/USD交易信號:在1.0808下方賣出(21 SMA - 8/8 Murray)

在美國市場早期階段,EUR/USD貨幣對的交易價格在約1.0786,低於21SMA。該工具正處於下行趨勢。

Dimitrios Zappas 15:13 2025-03-26 UTC+2

2025年3月26日至28日GOLD (XAU/USD) 交易信號:在$3,034以下賣出(21 SMA - 7/8 Murray)

在美國交易時段早期,黃金在3,029點位交易,位於3月18日形成的下降通道內且高於21 SMA。我們觀察到多頭力量的消弱跡象。

Dimitrios Zappas 15:11 2025-03-26 UTC+2

外匯預測 2025/03/26:EUR/USD、GBP/USD、黃金和比特幣

實用連結: 我的其他文章可以在此位區找到 InstaForex 初學者課程 熱門分析 開立交易賬戶 重要: 外匯交易的新手在決定進入市場時需要非常謹慎。在重要報告發佈前,最好保持觀望以避免因波動性增加而引發的劇烈市場波動。

Sebastian Seliga 10:35 2025-03-26 UTC+2

歐元/美元。3月26日。空頭準備發起新攻勢

週二,EUR/USD 貨幣對再次從 1.0781–1.0797 支撐區反彈,但由於缺乏支撐性的新聞背景,多頭表現較弱。今天,該貨幣對再次回到同一個 1.0781–1.0797 區域。

Samir Klishi 10:32 2025-03-26 UTC+2

英鎊/美元。3月26日。通脹可能影響英鎊走勢

在小時圖上,英鎊/美元貨幣對在週二繼續橫盤,對 1.2931 水平沒有反應。因此,是否突破該水平的收盤不會被視為一個交易信號。

Samir Klishi 10:29 2025-03-26 UTC+2

2025年3月26日星期三,澳元/日元交叉貨幣對的日內價格波動技術分析。

從4小時圖可以看出,AUD/JPY交叉匯率正在和諧地移動在一個看漲通道中,並且位於EMA (21)之上,這條指數移動平均線的斜率也向上傾斜。此外,AUD/JPY的價格走勢與隨機振盪指標之間的匯聚進一步強化了其目前由買家主導的確認。

Arief Makmur 09:34 2025-03-26 UTC+2

2025年3月26日星期三,納斯達克100指數日內價格波動的技術分析。

20405.7 隨著納斯達克 100 指數價格走勢與隨機指標出現收斂現象,且指數價格走勢高於上升斜率的 EMA (21),在不久的將來,#NDX 有可能從其疲軟中得到修正,目前正在走強朝著20405.7的位置前進,如果強勁勢頭和波動性支持的話,#NDX 將朝向20845.7,但請注意,上升擴大楔形形態的出現也有可能使#NDX回到其原初的偏向。然而,只要疲軟沒有突破並在19389.6之下收盤,那麼疲軟只是一次修正。

Arief Makmur 09:34 2025-03-26 UTC+2

EUR/USD和GBP/USD 3月26日 – 技術分析

隨著本週的開始,空頭玩家正試圖確認並擴大現行的下降趨勢,但他們尚未取得強而有力的結果——該貨幣對仍然接近週線水平。(1.0819 – 1.0828)。

Evangelos Poulakis 04:26 2025-03-26 UTC+2

歐元/美元。3月25日。無聊的一週即將到來

週一,歐元兌美元(EUR/USD) 雙向從200.0%斐波那契回撤水平1.0857反彈,轉向有利於美元,並下跌至支撐區1.0781–1.0797。今天從這個區域反彈將對歐元有利,並觸發新的上升趨勢,朝1.0857水平移動。

Samir Klishi 18:04 2025-03-25 UTC+2
现在无法通话?
提出您的问题,用 在线帮助.
Widget callback